Uncovering Patterns in Win Distributions Across Games with Tiered Jackpot Features
Kirjoittanut Felix Braun · 7.10.2026
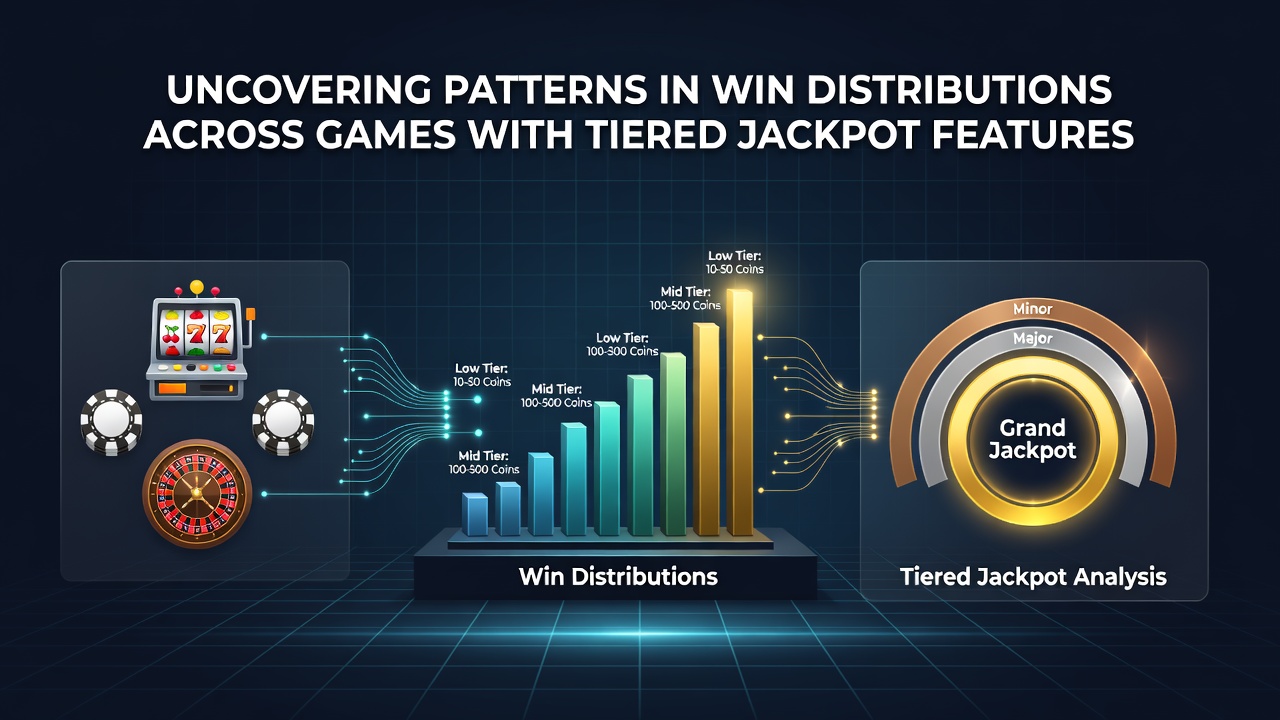
Uncovering Patterns in Win Distributions Across Games with Tiered Jackpot Features
Games featuring tiered jackpot structures divide prize pools into multiple levels that range from frequent smaller awards to rare top-tier payouts and these mechanics create distinct win distribution patterns that analysts track across different titles and platforms. Data collected from regulated markets shows that lower tiers trigger more often while higher levels follow longer intervals yet the overall distribution shifts based on game design parameters such as contribution rates and trigger thresholds.
Mechanics Behind Tiered Jackpot Structures
Developers configure tiered systems so that each level draws from separate contribution percentages and this separation allows operators to balance hit frequencies across the board. Research from the Nevada Gaming Control Board indicates that contribution rates typically allocate between 1 and 3 percent of each bet to the top tier while lower tiers receive smaller shares that reset more frequently. Those patterns emerge because the mathematical models set specific random number generator ranges for each tier and players encounter the lower awards at intervals measured in hundreds of spins rather than thousands.
Observers note that cross-game comparisons reveal consistent clustering where certain titles produce win distributions that favor mid-tier hits more than others and these differences stem from variations in reel layouts and bonus trigger conditions. In October 2026 industry updates highlighted several new releases that adjusted tier weighting to align with updated regulatory guidelines in multiple jurisdictions.
Data Patterns Across Multiple Game Categories
Studies of video slots and video poker variants with tiered jackpots demonstrate that win distributions follow power-law curves in which the probability decreases sharply as payout size increases. Figures compiled by the Ontario Lottery and Gaming Corporation reveal that mini and minor jackpots account for over 85 percent of all tiered wins while major and grand levels represent less than 5 percent combined. This distribution holds across thousands of recorded sessions and it persists even when game themes change because the underlying probability tables remain the dominant factor.
Yet variations appear when games incorporate community-style progressives that link multiple machines and these networked setups produce slightly flatter distributions at the upper tiers because pooled contributions accelerate growth rates. Analysts examining session logs find that players experience longer dry spells between grand-level wins in standalone games compared with linked versions and the difference becomes measurable after several hundred thousand spins.

Regional Variations in Observed Distributions
Regulatory data from different markets shows that win patterns adapt to local rules on prize capping and reset values. European operators following guidelines from the Malta Gaming Authority report tighter clustering around mid-tier wins because caps limit top payouts and force more frequent resets. In contrast North American markets without strict caps exhibit wider spreads where grand jackpots grow larger before hitting and this stretches the tail of the distribution curve.
Academic papers from the University of Sydney's Gambling Research Unit examined over two million spins across tiered titles and confirmed that contribution rate adjustments produce predictable shifts in hit frequency without altering the overall shape of the distribution. Those findings align with operational reports that operators use to forecast liability and set promotional budgets.
Factors Influencing Distribution Shifts
Game volatility settings interact with tier structures to modify observed patterns and higher volatility titles push more wins toward the upper tiers at the expense of frequent small awards. Software providers publish theoretical return-to-player figures that incorporate these tier probabilities and independent testing labs verify the distributions before release. When operators change contribution percentages mid-cycle the resulting win patterns adjust within weeks as new data accumulates from live play.
Seasonal events and marketing campaigns that boost play volume temporarily compress the intervals between tier triggers but the underlying ratios stay constant once volume normalizes. Analysts track these temporary deviations through real-time dashboards that compare current session data against historical baselines.
Conclusion
Win distributions in tiered jackpot games follow measurable patterns shaped by contribution rates, volatility settings and regulatory constraints across different markets. Data from multiple jurisdictions demonstrates that lower tiers dominate frequency statistics while higher tiers extend the tail of the payout curve. Continued monitoring of session logs and regulatory filings allows operators and researchers to map these distributions accurately and anticipate how design changes will affect player experiences in the coming periods.